©Richard Lowry, 1999-
All rights reserved.
Chapter 2. Distributions Part 3
Varieties of Distributions: Samples, Populations, and Theoretical Distributions
Up to this point we have been speaking of distributions as though they were all cut from the same fabric. In fact they are cut from several different kinds of fabric, and the closer we get to the subject matter of inferential statistics, the more critically important it becomes to understand exactly what general type of distribution you are dealing with in any particular context. The most general distinction among distributions pertains to whether they are empirical or theoretical.
An empirical distribution is one composed of some set of variates—that is, values of Xi—that have either been observed or are capable in principle of being observed. If you were to measure the level of serum cholesterol of 100 adult Canadian males, the resulting 100 values of Xi would constitute an empirical distribution. If you were to speak of the distribution of serum cholesterol levels among adult Canadian males in general, that too would be an empirical distribution, even though you might not have observed all or even most of the multitudinous Xi values of which this distribution is composed.
A theoretical distribution, on the other hand, is one that is derived from certain basic facts, principles, or assumptions, by logical and mathematical reasoning involving a more or less complex sequence of conditional statements of the general form "If such-and-such is true, then so-and-so must also be true." In general, the procedures of inferential statistics begin with one or more empirical distributions and conclude by making reference to a theoretical probability distribution.
A Brief Introduction to one Particular Form of Theoretical Distribution
Lest the term theoretical conjure up images in your mind of ivory-tower impracticality, please be assured that our interest here is no mere intellectual exercise. In fact, theoretical distributions of the type that allow us to make rational judgments concerning probability are what lie at the very heart of the whole enterprise of inferential statistics. They are what make inferential statistics inferential, rather than merely descriptive; they are also what make the study of statistical methodology worth the bother. Although we will not be able to say much about theoretical probability distributions until we have covered some basic concepts of probability, there is one particular species of theoretical distribution that we will be referring to before that time, so you will need to have at least a general sense of it. Actually, it is a form of distribution that you have probably already encountered in some previous context, perhaps under its popular and unofficial title, the bell-shaped curve. Its official name is the normal distribution.
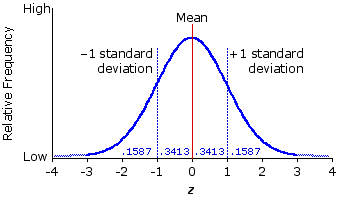
The general outlines of the normal distribution are shown in Figure 2.6. Although the curve that you see in this graph looks as though it might be a smoothed polygon outlining an empirical frequency distribution, it is in fact a mathematical abstraction, generated by a formula known as the normal probability density function. You will not need to be able to generate it yourself, nor will you need to do any of the higher mathematics required to work out its detailed properties and implications. That has already been done for us, long ago, by the pioneers of statistical theory. For present purposes, you can think of this graph as representing an abstract frequency distribution.
Figure 2.6. The Theoretical Normal Distribution
The vertical axis in the graph delineates relative frequencies, which could be scaled as either percentages or proportions, and the horizontal axis represents units of z—that is, distances from the mean of the distribution, with each unit of z equal to one standard deviation. The mean of the distribution (z=0) stands precisely at its center, and plus-and-minus one standard deviation (+1z and —1z) fall precisely at the points where the curved outline of the distribution on either side of the mean changes from convex to concave. The range between +1 and —1 standard deviation encompasses approximately two-thirds (68.26%) of the total distribution, with equal portions (34.13%) falling between the mean and —1 standard deviation and between the mean and +1 standard deviation. The remaining 31.74% falls in equal portions of 15.87% to the left of —1 standard deviation and to the right of +1 standard deviation. These are only some of the more immediately visible properties of the normal distribution. We will save the others for a more thorough discussion in later chapters.
This particular theoretical distribution first arose in the eighteenth and nineteenth centuries in connection with the attempt to specify the probabilities, or odds, that are involved in certain games of chance. At first it was purely theoretical and of no particular interest to anyone apart from gamblers and mathematicians. But with the passage of time it became increasingly clear that the general shape of the theoretical distribution tends to be closely approximated by the distributions of a very large number of real-world empirical variables. So here you have it in the proverbial nutshell—a mathematical abstraction inspired by frivolous games of chance, which nonetheless turns out to be applicable to a very wide range of scientifically interesting real-world phenomena. You will see numerous examples of the applicability of this and other theoretical probability distributions as we proceed.
Empirical Distributions: Populations and Samples
The particular point on which the applicability of these theoretical distributions is focused is in the relationship between populations and samples. The statistical distinction between populations and samples is basically the distinction between all and some. If you were to measure all instances of some particular variable, the result would be a population distribution. If you were to measure only a limited subset of the instances of that variable, and take those measures to be representative of the entire set of instances, the result would be a sample distribution. Thus, if our distribution of N=12 exam scores comes from a class that has exactly 12 students in it, and if we are interested in nothing other than how this particular class of 12 students performed on this particular exam, then what we are dealing with is the distribution of the entire population of the instances in which we happen to be interested.
Suppose, however, that the class actually has 60 students in it, and that the instructor, after grading the first 12 exams, takes a moment to examine the distribution of this limited subset of scores in order to get a sense of how the 60 students in general did on the exam. In this case, the exam scores of all 60 students (even though most of the exams have not yet been graded) would constitute the population distribution, and the 12 exam scores of the subset would constitute a sample distribution that the instructor takes to be representative of this population.
Alternatively, suppose that the instructor, who plans to give slightly modified versions of this particular exam to other classes over the next several years, examines the distribution of all 60 exam scores in the current class to get a sense of how students in general will do on the exam in subsequent years. In this case the 60 exam scores are not a population, but rather a sample taken to be representative of a considerably larger population, namely, the as-yet nonexistent scores of an as-yet undetermined number of students who will be taking the exam in subsequent editions of the course.
The distinction is important enough to bear repeating: a population includes all instances of the particular variable in which you happen to be interested, irrespective of whether all these instances have actually been observed; while a sample includes only a limited subset of the population, selected in such a way as to insure that it is representative of the totality of the population. And while we are at it, please note carefully that this technical statistical sense of population is not limited to populations of people. You can also have populations of cats, rats, mice, lice, jonquils, junipers, paramecia, erythrocytes, galaxies, water molecules, hydrogen atoms, and electrons. Indeed, any type of empirical fact at all can be thought of as constituting a population, providing that the reference is to all instances of it. Thus, you could speak not only of the population of tree squirrels in a locality, but also of the population of tree squirrel nests, or of the populations of heights or sizes of tree squirrel nests.
When the great 18th century chemist Lavoisier showed precisely how hydrogen and oxygen combine to form water, he was not interested just in this, that, or the other particular sample of hydrogen, or oxygen, or water, but in the entire population of water molecules and the entire population of instances—past, present, and future—in which hydrogen and oxygen might combine in certain proportions and under certain conditions of temperature and barometric pressure. When Newton, about a century earlier, examined the effect of earth-moon gravitational interactions upon oceanic tides, he was not interested just in this, that, or the other particular sample of gravitational effects, but in the entire population of gravitational interactions.
Although the scope of scientific research has broadened very considerably since the days of Newton and Lavoisier, the central aim and strategy remain the same. The overarching aim of the various sciences is to figure out the general facts and principles that pertain to their respective domains of phenomena. But the populations of phenomena to which these general facts and principles refer are typically too large or otherwise inaccessible to be examined in their totality, so they are instead examined by way of systematic sampling. The essential task of inferential statistics is to determine what can reasonably be concluded about an entire domain of phenomena—a population—on the basis of having examined only a limited sample of instances drawn from that domain. As you will see later in considerable detail, the key to accomplishing this task is provided by the theory of probability.
Up to this point we have been like a runner doing warm-up exercises, preparing to run, but not yet actually running. Now the warm-up period is over and the race is about to begin. At first the effort might seem more strenuous, but once you find your stride, I think you will discover that the running flows much more smoothly than the warm-up. We begin in Chapter 3 by performing some full-blown statistical analyses in connection with a concept that you have certainly already encountered elsewhere under the label of correlation. Historically, this was one of the first forms of statistical analysis to be developed (ca. 1846—1896), and it remains to this day one of the most often and productively employed statistical instruments of scientific research.
End of Chapter 2An empirical distribution is one composed of some set of variates—that is, values of Xi—that have either been observed or are capable in principle of being observed. If you were to measure the level of serum cholesterol of 100 adult Canadian males, the resulting 100 values of Xi would constitute an empirical distribution. If you were to speak of the distribution of serum cholesterol levels among adult Canadian males in general, that too would be an empirical distribution, even though you might not have observed all or even most of the multitudinous Xi values of which this distribution is composed.
A theoretical distribution, on the other hand, is one that is derived from certain basic facts, principles, or assumptions, by logical and mathematical reasoning involving a more or less complex sequence of conditional statements of the general form "If such-and-such is true, then so-and-so must also be true." In general, the procedures of inferential statistics begin with one or more empirical distributions and conclude by making reference to a theoretical probability distribution.
A Brief Introduction to one Particular Form of Theoretical Distribution
Lest the term theoretical conjure up images in your mind of ivory-tower impracticality, please be assured that our interest here is no mere intellectual exercise. In fact, theoretical distributions of the type that allow us to make rational judgments concerning probability are what lie at the very heart of the whole enterprise of inferential statistics. They are what make inferential statistics inferential, rather than merely descriptive; they are also what make the study of statistical methodology worth the bother. Although we will not be able to say much about theoretical probability distributions until we have covered some basic concepts of probability, there is one particular species of theoretical distribution that we will be referring to before that time, so you will need to have at least a general sense of it. Actually, it is a form of distribution that you have probably already encountered in some previous context, perhaps under its popular and unofficial title, the bell-shaped curve. Its official name is the normal distribution.
The general outlines of the normal distribution are shown in Figure 2.6. Although the curve that you see in this graph looks as though it might be a smoothed polygon outlining an empirical frequency distribution, it is in fact a mathematical abstraction, generated by a formula known as the normal probability density function. You will not need to be able to generate it yourself, nor will you need to do any of the higher mathematics required to work out its detailed properties and implications. That has already been done for us, long ago, by the pioneers of statistical theory. For present purposes, you can think of this graph as representing an abstract frequency distribution.
Figure 2.6. The Theoretical Normal Distribution
|
This particular theoretical distribution first arose in the eighteenth and nineteenth centuries in connection with the attempt to specify the probabilities, or odds, that are involved in certain games of chance. At first it was purely theoretical and of no particular interest to anyone apart from gamblers and mathematicians. But with the passage of time it became increasingly clear that the general shape of the theoretical distribution tends to be closely approximated by the distributions of a very large number of real-world empirical variables. So here you have it in the proverbial nutshell—a mathematical abstraction inspired by frivolous games of chance, which nonetheless turns out to be applicable to a very wide range of scientifically interesting real-world phenomena. You will see numerous examples of the applicability of this and other theoretical probability distributions as we proceed.
Empirical Distributions: Populations and Samples
The particular point on which the applicability of these theoretical distributions is focused is in the relationship between populations and samples. The statistical distinction between populations and samples is basically the distinction between all and some. If you were to measure all instances of some particular variable, the result would be a population distribution. If you were to measure only a limited subset of the instances of that variable, and take those measures to be representative of the entire set of instances, the result would be a sample distribution. Thus, if our distribution of N=12 exam scores comes from a class that has exactly 12 students in it, and if we are interested in nothing other than how this particular class of 12 students performed on this particular exam, then what we are dealing with is the distribution of the entire population of the instances in which we happen to be interested.
Suppose, however, that the class actually has 60 students in it, and that the instructor, after grading the first 12 exams, takes a moment to examine the distribution of this limited subset of scores in order to get a sense of how the 60 students in general did on the exam. In this case, the exam scores of all 60 students (even though most of the exams have not yet been graded) would constitute the population distribution, and the 12 exam scores of the subset would constitute a sample distribution that the instructor takes to be representative of this population.
Alternatively, suppose that the instructor, who plans to give slightly modified versions of this particular exam to other classes over the next several years, examines the distribution of all 60 exam scores in the current class to get a sense of how students in general will do on the exam in subsequent years. In this case the 60 exam scores are not a population, but rather a sample taken to be representative of a considerably larger population, namely, the as-yet nonexistent scores of an as-yet undetermined number of students who will be taking the exam in subsequent editions of the course.
The distinction is important enough to bear repeating: a population includes all instances of the particular variable in which you happen to be interested, irrespective of whether all these instances have actually been observed; while a sample includes only a limited subset of the population, selected in such a way as to insure that it is representative of the totality of the population. And while we are at it, please note carefully that this technical statistical sense of population is not limited to populations of people. You can also have populations of cats, rats, mice, lice, jonquils, junipers, paramecia, erythrocytes, galaxies, water molecules, hydrogen atoms, and electrons. Indeed, any type of empirical fact at all can be thought of as constituting a population, providing that the reference is to all instances of it. Thus, you could speak not only of the population of tree squirrels in a locality, but also of the population of tree squirrel nests, or of the populations of heights or sizes of tree squirrel nests.
When the great 18th century chemist Lavoisier showed precisely how hydrogen and oxygen combine to form water, he was not interested just in this, that, or the other particular sample of hydrogen, or oxygen, or water, but in the entire population of water molecules and the entire population of instances—past, present, and future—in which hydrogen and oxygen might combine in certain proportions and under certain conditions of temperature and barometric pressure. When Newton, about a century earlier, examined the effect of earth-moon gravitational interactions upon oceanic tides, he was not interested just in this, that, or the other particular sample of gravitational effects, but in the entire population of gravitational interactions.
Although the scope of scientific research has broadened very considerably since the days of Newton and Lavoisier, the central aim and strategy remain the same. The overarching aim of the various sciences is to figure out the general facts and principles that pertain to their respective domains of phenomena. But the populations of phenomena to which these general facts and principles refer are typically too large or otherwise inaccessible to be examined in their totality, so they are instead examined by way of systematic sampling. The essential task of inferential statistics is to determine what can reasonably be concluded about an entire domain of phenomena—a population—on the basis of having examined only a limited sample of instances drawn from that domain. As you will see later in considerable detail, the key to accomplishing this task is provided by the theory of probability.
Up to this point we have been like a runner doing warm-up exercises, preparing to run, but not yet actually running. Now the warm-up period is over and the race is about to begin. At first the effort might seem more strenuous, but once you find your stride, I think you will discover that the running flows much more smoothly than the warm-up. We begin in Chapter 3 by performing some full-blown statistical analyses in connection with a concept that you have certainly already encountered elsewhere under the label of correlation. Historically, this was one of the first forms of statistical analysis to be developed (ca. 1846—1896), and it remains to this day one of the most often and productively employed statistical instruments of scientific research.
Return to Top of Chapter 2, Part 3
Go to Chapter 3, Part 1 [Introduction to Correlation and Regression]
| Home | Click this link only if the present page does not appear in a frameset headed by the logo Concepts and Applications of Inferential Statistics |