©Richard Lowry, 1999-
All rights reserved.
Chapter 4. A First Glance at the Question of Statistical Significance
"How often things occur by the merest chance."
—Terence, Phormio
Although this chapter is fairly brief, it is quite central, for this is where we take our first pass at the critically important question of statistical significance. As we noted in Chapter 2, the essential task of inferential statistics is to determine what can reasonably be concluded about an entire domain of phenomena—a population—on the basis of having examined only a limited sample of instances drawn from that domain. A 'sample' is a relatively small window through which the investigator hopes to see the outlines of some larger, more inclusive reality. In some cases, the glimpse provided by the sample might truly represent the larger reality, while in other cases it might misrepresent it, leading the investigator to erroneous conclusions. This latter possibility derives from the fact that the phenomena of nature are often shot through and through with random variability. While the risk of drawing erroneous conclusions from a limited sample is considerable within any domain of phenomena, it is especially great in those domains that pertain to the mentality, behavior, and biology of living organisms.
At any rate, whenever there is random variability inherent in the phenomena under investigation, there is always the possibility that the observed facts result from nothing other than mere chance coincidence; and until that possibility is rigorously assessed, no conclusions can reasonably be drawn from a sample, one way or the other. 'Statistical significance' is the logical and mathematical apparatus by which that assessment is accomplished. This is far and away the most commonly encountered question of inferential statistics within the various fields of scientific research: "Here are some facts that we have extracted from the complex, chance-infused flow of real-world events. Now that we have them, how confident can we be that they signify anything more than mere chance, mere random coincidence—the luck of the scientific draw, so to speak?"
Within the context of correlation, the question of statistical significance concerns the relationship between r, which is the correlation that is observed within a limited sample of XiYi pairs, and rho, which is the correlation that exists, in the larger reality beyond the sample, between X and Y in general. The reason why the question arises is that it is possible, by the merest chance coincidence, to obtain rather impressive-looking values of r within a sample, even when the correlation between X and Y in general isrho=0. This is especially true when the size of the sample is small, but decreasingly so as the size of the sample increases.
Here is a simple experiment by which you can gain some hands-on experience with the general principle to which this statement is referring. If you repeatedly toss a pair of dice, there is no reason at all to expect that the paired outcomes of the dice would be correlated. Another way of saying it is that the correlation within the entire potential population of paired dice outcomes isrho=0. Now for the experiment. For each of its two parts you will need a pair of dice, preferably of different colors. One of the dice is designated as X and the other as Y.
A few years ago I have had the students in several of my own statistics classes perform these exercises, and in the process collected one batch of 473 correlation coefficients, each based on a sample of N=5 paired dice outcomes, and another batch of 424 correlation coefficients, each based on a sample of N=10 paired dice outcomes. The distributions of these two batches of sample correlation coefficients are shown in Figure 4.1. For purposes of illustration, the portions of the two histograms representing sample values of r that deviated from the central value of zero by as much as ±0.50 are marked off and colored in light blue. As you can see, these blue areas of the distributions include nearly 40% of the correlation coefficients based on samples of size N=5 (Figure 4.1a), but only about 12% of those based on samples of size N=10 (Figure 4.1b).
Figure 4.1. Observed Distributions of Random Values of r Drawn from Populations for whichrho=0
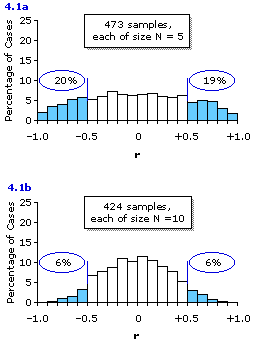
The somewhat jagged outlines of the distributions shown in Figure 4.1 are explained by the fact that our batches of 473 and 424 samples, although large in terms of time and effort, are still relatively small in comparison with the number of samples that could have been taken, if only my students had been willing to make a life-time commitment to the experiment. Luckily for both them and me, this life-long labor is not really necessary, since the true forms of these distributions of sample values of r are already known. The knowledge of them comes not from anyone actually observing several hundred million paired dice outcomes, but from logical and mathematical reasoning grounded on the basic concepts of probability that we will begin examining in Chapter 5.
Although the process begins with a question that seems highly abstract and hypothetical, the result that comes from it has a very wide range of practical application. Imagine a population of XiYi pairs—paired dice outcomes, or anything else—for which the overall correlation isrho=0. If you were to draw a vast number of bivariate samples from that population, each sample of size N=5, and calculate the correlation coefficient for each sample, and then lay all of these sample values of r out in the form of a relative frequency distribution—what would that distribution look like?
The answer to this question is depicted in Figure 4.2a, which you will see looks very much like the distribution of 473 sample values of r shown in Figure 4.1a, except that it is smoother and precisely symmetrical. Here again, as a convenient reference point, the portion of the distribution representing sample values of r that would deviate from the central value of zero by as much as ±0.50 are marked off and colored in light blue. As indicated, this would include about 40% of the distribution. That is, about 20% of your multitude of sample correlation coefficients would be as large or larger than+0.50 in the positive direction, and about 20% would be as large or larger than —0.50 in the negative direction. Another way of putting it is that any particular one of the samples has about a 20% likelihood of coming out, by mere chance, with a correlation coefficient equal to or greater than +0.50 in the positive direction, and about a 20% likelihood of coming out, by mere chance, with a correlation coefficient equal to or greater than —0.50 in the negative direction. The principle applies not just to the tossing of dice, but to bivariate situations in general where (i) the correlation within the entire population is rho=0, and (ii) the samples drawn from the population are of size N=5.
Figure 4.2. Theoretical Distributions of Random Values of r (N=5 and N=10) Drawn from Populations for whichrho=0

Figure 4.2b shows the same type of theoretical distribution for the case where the correlation within the entire population isrho=0 and the samples are of size N=10. Here as well, you can see that the theoretical distribution for samples of size N=10 looks very much like the corresponding distribution of 424 actual samples (Figure 4.1b), except that it is smoother and precisely symmetrical. In this situation only about 12% of the sample values of r would deviate from zero by as much as ±0.50. Half of this 12% would fall at or beyond +0.50 in the positive direction, and the other half would fall at or beyond —0.50 in the negative direction. Alternatively, you can say that any particular one of the samples has about a 6% likelihood of coming out, by mere chance, with a correlation coefficient equal to or greater than +0.50 in the positive direction, and about a 6% likelihood of coming out, by mere chance, with a correlation coefficient equal to or greater than —0.50 in the negative direction.
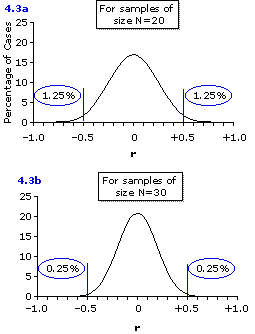
You have probably already noticed that the outline of the distribution shown in Figure 4.2b looks like a somewhat squat version of a normal distribution. In fact, it is not a normal distribution; though as you can see from the graphs in Figure 4.3, below, theoretical distributions of this general type do come closer and closer to the form of a normal distribution as you increase the size of the samples. By the time you reach a sample size ofN=30 (Figure 4.3b), the shape of the distribution of sample correlation coefficients is virtually identical to that of a normal distribution. Notice also in these two remaining graphs that increasing the size of the samples decreases even further the tendency of sample correlation coefficients to deviate from the zero correlation that exists within the population from which the samples are drawn. Thus, for samples of size N=20 (Figure 4.3a) it is only 2.5% of the sample values of r that will deviate from zero by as much as ±0.50, and for samples of size N=30 (Figure 4.3b) it is only 0.5%.
Figure 4.3. Theoretical Distributions of Random Values of r (N=20 and N=30) Drawn from Populations for whichrho=0
Consider, now, the following hypothetical scenario. A team of medical investigators is exploring the properties of a newly discovered human nutrient, which temporarily goes by the name of nutrient X. On the basis of what is known about the chemical properties of nutrient X, the investigators hypothesize that it should have the effect of increasing the production of a certain blood component, called factor Y, that is known to play an important role in strengthening the body's resistance to infection. To test this hypothesis, the investigators measure average daily intake of nutrient X over a period of time for a certain number of normal adult human subjects; and then, at the end of that period they draw a small volume of blood from each subject and measure the number of units of factor Y. Upon analyzing their results, they find the correlation between
for this particular sample to be r=+0.50. In short, their hypothesis led them to expect a positive correlation between X and Y within the sample, and that is exactly what they found.
Now comes the question of statistical significance, which boiled down to its barest bones is simply this. Given that impressive-looking correlations can occur within limited samples, even when there is no correlation at all between X and Y in the larger reality beyond the sample, what confidence can we have that the +0.50 correlation observed in this particular case is not just a fluke of mere chance coincidence?
From what we said just prior to talking about nutrient X and factor Y, you can see that the answer to this question obviously depends on the size of the sample, which in our description of this hypothetical experiment was left unspecified. If the size of the sampleis N=5, then the investigators will have a 20% chance of observing a positive correlation coefficient as large as +0.50 even if the correlation within the entire population is merely rho=0. With a sample of size N=10 it drops to a 6% chance; for N=20 it falls further to a scant 1.25% chance; and for N=30 it falls even further to a minuscule one-quarter of one percent. Clearly, the larger the size of the investigators' sample, the more confidence you can have that their observed correlation of r=+0.50 is not just a fluke of mere chance coincidence.
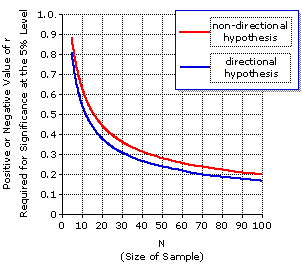
In most areas of scientific research, the criterion for statistical significance is conventionally set at the 5% level. That is, an observed result is regarded as statistically significant—as something more than a mere fluke—only if it had a 5% or smaller likelihood of occurring by mere chance coincidence. Otherwise, it is regarded as statistically non-significant. We will be examining the concept of statistical significance at much greater length in later chapters, not only for correlation but for numerous other statistical procedures as well. For whatever immediate need you might have to determine the significance of a correlation coefficient, you will be able to get by with the information presented in Table 4.1 and in Figure 4.4. Table 4.1 shows the positive or negative values of r that are required for statistical significance at the 5% level for various sample sizes, fromN=5 through N=32, and for two different kinds of situations to be described below. Figure 4.4 shows the same information in graphic form, but extended across a wider range of sample sizes, from N=5 to N=100.
Table 4.1. Positive or Negative Values of r Required for Statistical Significance at the 5% Level, for Samples of Size N=5 through N=32
Figure 4.4. Values of r Required for Statistical Significance at the 5% Level, for Samples of SizeN=5 through N=100
The difference between the two kinds of situations is defined by the investigator's hypothesis, which is either directional or non-directional. Within the context of correlation, a directional hypothesis is one that leads the investigator to specify, in advance, one or the other of the following expectations:
A non-directional hypothesis, on the other hand, leads only to the expectation that the correlation between X and Y within the general population might be something other than zero, with no specification of the particular direction in which it might go. Essentially, it is an either-or combination of the two types of directional hypothesis:
The important logical difference between these two kinds of situations is that a non-directional hypothesis could potentially be supported by finding either a positive or a negative correlation within the sample, whereas a directional hypothesis could be supported only by finding a correlation within the sample that is in the direction specified; that is, only by finding a positive correlation when the positive direction has been specified, and only by finding a negative correlation when the negative direction has been specified. This logical difference between the two situations entails a different standard of statistical significance. Specifically, for any particular sample size, the value of r required for significance at the 5% level is larger for a non-directional hypothesis than for a directional hypothesis. You need not worry just yet about the detailed rationale of this point. For the moment, it is sufficient to understand the basic distinction between directional and non-directional hypotheses, and to know that the standard of statistical significance for a non-directional hypothesis is more stringent.
In our imaginary study of the relationship between nutrient X and blood factor Y, the investigators specified in advance that they expected the correlation to be positive. Hence, the applicable standard of statistical significance is the one that pertains to directional hypotheses. If the sample in this study was only ofsize N=5, the required value of r (see Table 4.1) would be +0.81; so the observed correlation of +0.50, falling short of this required value, would be non-significant. It would also fall short of the required values for a sample of size N=6, 7, 8, 9, 10, or 11. For a sample of size N=12, however, the observed value of +0.50 hits the required value dead center; so for a sample of this size, the observed correlation coefficient would be significant precisely at the 5% level. For any sample size larger than N=12, the observed value of +0.50 would be larger than the required value, and so it would be significant even beyond the 5% level.
For our earlier SAT example we had a sample of sizeN=50 and an observed correlation coefficient of r=—0.86. We might conceivably have had some reason to specify a negative directional hypothesis in advance of examining the data—but as we did not, in fact, make that specification, the applicable standard must be the one for a non-directional hypothesis. Here the relevant information is found in Figure 4.4. Start at the horizontal axis where N is equal to 50; go straight up to the red line, which refers to the standard of significance for a non-directional hypothesis; then go straight across to the left to find the required value of r on the vertical axis. That required value is r=±0.28, which means that for a sample of size N=50 and a non-directional hypothesis, an observed correlation coefficient of either r=+0.28 or r=—0.28 would be significant precisely at the 5% level, and that an observed r greater than +0.28 in the positive direction, or greater than —0.28 in the negative direction, would be significant beyond the 5% level. Our actually observed correlation coefficient of r=—0.86 is therefore significant beyond the 5% level. In a later chapter we will describe a much more precise computational method for determining the statistical significance of a correlation coefficient for all possible values of N and for a wider range of levels of significance. At that time you will see that our observed correlation of r=—0.86 for the SAT example is significant not only beyond the 5% level, but also considerably beyond the 1% level.
Ah! But how do we know all these things? How can we say with such apodictic certainty that the mere-chance XY outcomes of a pair of dice tossed 10 times will have a 6% chance of yielding a correlation coefficient equal to or greaterthan +0.50? The answer to this and a very large range of similar questions rests upon the concepts that we will begin examining in Chapters 5 and 6. In Chapter 7 we will then return for another brief interlude on statistical significance, to draw out some further details of the concept.
At any rate, whenever there is random variability inherent in the phenomena under investigation, there is always the possibility that the observed facts result from nothing other than mere chance coincidence; and until that possibility is rigorously assessed, no conclusions can reasonably be drawn from a sample, one way or the other. 'Statistical significance' is the logical and mathematical apparatus by which that assessment is accomplished. This is far and away the most commonly encountered question of inferential statistics within the various fields of scientific research: "Here are some facts that we have extracted from the complex, chance-infused flow of real-world events. Now that we have them, how confident can we be that they signify anything more than mere chance, mere random coincidence—the luck of the scientific draw, so to speak?"
Within the context of correlation, the question of statistical significance concerns the relationship between r, which is the correlation that is observed within a limited sample of XiYi pairs, and rho, which is the correlation that exists, in the larger reality beyond the sample, between X and Y in general. The reason why the question arises is that it is possible, by the merest chance coincidence, to obtain rather impressive-looking values of r within a sample, even when the correlation between X and Y in general is
Here is a simple experiment by which you can gain some hands-on experience with the general principle to which this statement is referring. If you repeatedly toss a pair of dice, there is no reason at all to expect that the paired outcomes of the dice would be correlated. Another way of saying it is that the correlation within the entire potential population of paired dice outcomes is
|
Part I. Toss the dice together 5 times, recording for each toss the number that comes up for X and the number that comes up for Y. The possibilities are of course 1, 2, 3, 4, 5, or 6 for each of the two dice on each toss. Then calculate the correlation coefficient for your 5 XiYi pairs. Record this calculated value of r, and then repeat the whole operation again and again, for as many times as you have the energy and patience If you feel foolish while doing it, keep reminding yourself that you are not merely tossing dice. What you are really doing is collecting a multiplicity of random bivariate samples, each of size Part II. Now do the same thing as in part I, but this time make your samples of size |
Note that the phrase “as much as” means “this much or more.”
[Close]
Figure 4.1. Observed Distributions of Random Values of r Drawn from Populations for which
The somewhat jagged outlines of the distributions shown in Figure 4.1 are explained by the fact that our batches of 473 and 424 samples, although large in terms of time and effort, are still relatively small in comparison with the number of samples that could have been taken, if only my students had been willing to make a life-time commitment to the experiment. Luckily for both them and me, this life-long labor is not really necessary, since the true forms of these distributions of sample values of r are already known. The knowledge of them comes not from anyone actually observing several hundred million paired dice outcomes, but from logical and mathematical reasoning grounded on the basic concepts of probability that we will begin examining in Chapter 5.
Although the process begins with a question that seems highly abstract and hypothetical, the result that comes from it has a very wide range of practical application. Imagine a population of XiYi pairs—paired dice outcomes, or anything else—for which the overall correlation is
The answer to this question is depicted in Figure 4.2a, which you will see looks very much like the distribution of 473 sample values of r shown in Figure 4.1a, except that it is smoother and precisely symmetrical. Here again, as a convenient reference point, the portion of the distribution representing sample values of r that would deviate from the central value of zero by as much as ±0.50 are marked off and colored in light blue. As indicated, this would include about 40% of the distribution. That is, about 20% of your multitude of sample correlation coefficients would be as large or larger than
Figure 4.2. Theoretical Distributions of Random Values of r (N=5 and N=10) Drawn from Populations for which
Figure 4.2b shows the same type of theoretical distribution for the case where the correlation within the entire population is
You have probably already noticed that the outline of the distribution shown in Figure 4.2b looks like a somewhat squat version of a normal distribution. In fact, it is not a normal distribution; though as you can see from the graphs in Figure 4.3, below, theoretical distributions of this general type do come closer and closer to the form of a normal distribution as you increase the size of the samples. By the time you reach a sample size of
Figure 4.3. Theoretical Distributions of Random Values of r (N=20 and N=30) Drawn from Populations for which
Consider, now, the following hypothetical scenario. A team of medical investigators is exploring the properties of a newly discovered human nutrient, which temporarily goes by the name of nutrient X. On the basis of what is known about the chemical properties of nutrient X, the investigators hypothesize that it should have the effect of increasing the production of a certain blood component, called factor Y, that is known to play an important role in strengthening the body's resistance to infection. To test this hypothesis, the investigators measure average daily intake of nutrient X over a period of time for a certain number of normal adult human subjects; and then, at the end of that period they draw a small volume of blood from each subject and measure the number of units of factor Y. Upon analyzing their results, they find the correlation between
| X : | average daily intake of nutrient X, and
|
| Y :
| number of units of factor Y per milliliter of blood
| |
Now comes the question of statistical significance, which boiled down to its barest bones is simply this. Given that impressive-looking correlations can occur within limited samples, even when there is no correlation at all between X and Y in the larger reality beyond the sample, what confidence can we have that the +0.50 correlation observed in this particular case is not just a fluke of mere chance coincidence?
From what we said just prior to talking about nutrient X and factor Y, you can see that the answer to this question obviously depends on the size of the sample, which in our description of this hypothetical experiment was left unspecified. If the size of the sample
In most areas of scientific research, the criterion for statistical significance is conventionally set at the 5% level. That is, an observed result is regarded as statistically significant—as something more than a mere fluke—only if it had a 5% or smaller likelihood of occurring by mere chance coincidence. Otherwise, it is regarded as statistically non-significant. We will be examining the concept of statistical significance at much greater length in later chapters, not only for correlation but for numerous other statistical procedures as well. For whatever immediate need you might have to determine the significance of a correlation coefficient, you will be able to get by with the information presented in Table 4.1 and in Figure 4.4. Table 4.1 shows the positive or negative values of r that are required for statistical significance at the 5% level for various sample sizes, from
Table 4.1. Positive or Negative Values of r Required for Statistical Significance at the 5% Level, for Samples of Size N=5 through N=32
For any particular sample size, an observed value of r is regarded as statistically significant at the 5% level if and only if its distance from zero is equal to or greater than the distance of the tabled value of r. Thus, for a sample of size |
| Hypothesis | Hypothesis|
| Directional | Non- | Directional
| Directional | Non- | Directional N | ± r | ± r | N | ± r | ± r | 5 | 6 7 8 9 10 11 12 13 14 15 16 17 18
0.81 | 0.73 0.67 0.62 0.58 0.55 0.52 0.50 0.48 0.46 0.44 0.43 0.41 0.40
0.88 | 0.81 0.75 0.71 0.67 0.63 0.60 0.58 0.55 0.53 0.51 0.50 0.48 0.47
19 | 20 21 22 23 24 25 26 27 28 29 30 31 32
0.39 | 0.38 0.37 0.36 0.35 0.34 0.34 0.33 0.32 0.32 0.31 0.31 0.30 0.30
0.46 | 0.44 0.43 0.42 0.41 0.40 0.40 0.39 0.38 0.37 0.37 0.36 0.36 0.35 | |||||
Figure 4.4. Values of r Required for Statistical Significance at the 5% Level, for Samples of Size
The difference between the two kinds of situations is defined by the investigator's hypothesis, which is either directional or non-directional. Within the context of correlation, a directional hypothesis is one that leads the investigator to specify, in advance, one or the other of the following expectations:
POSITIVE DIRECTIONAL HYPOTHESIS: the relationship between X and Y in the general population is positive (the more of X, the more of Y), hence this particular sample of XiYi pairs will show a positive correlation;|
| or
|
| NEGATIVE DIRECTIONAL HYPOTHESIS: the relationship between X and Y in the general population is negative (the more of X, the less of Y), hence this particular sample of XiYi pairs will show a negative correlation. | |
A non-directional hypothesis, on the other hand, leads only to the expectation that the correlation between X and Y within the general population might be something other than zero, with no specification of the particular direction in which it might go. Essentially, it is an either-or combination of the two types of directional hypothesis:
| NON-DIRECTIONAL HYPOTHESIS: the relationship between X and Y in the general population is something other than zero, hence this particular sample of XiYi pairs will show a non-zero correlation, either positive or negative, though we have no basis for predicting just which of these it will be. |
The important logical difference between these two kinds of situations is that a non-directional hypothesis could potentially be supported by finding either a positive or a negative correlation within the sample, whereas a directional hypothesis could be supported only by finding a correlation within the sample that is in the direction specified; that is, only by finding a positive correlation when the positive direction has been specified, and only by finding a negative correlation when the negative direction has been specified. This logical difference between the two situations entails a different standard of statistical significance. Specifically, for any particular sample size, the value of r required for significance at the 5% level is larger for a non-directional hypothesis than for a directional hypothesis. You need not worry just yet about the detailed rationale of this point. For the moment, it is sufficient to understand the basic distinction between directional and non-directional hypotheses, and to know that the standard of statistical significance for a non-directional hypothesis is more stringent.
In our imaginary study of the relationship between nutrient X and blood factor Y, the investigators specified in advance that they expected the correlation to be positive. Hence, the applicable standard of statistical significance is the one that pertains to directional hypotheses. If the sample in this study was only of
For our earlier SAT example we had a sample of size
Ah! But how do we know all these things? How can we say with such apodictic certainty that the mere-chance XY outcomes of a pair of dice tossed 10 times will have a 6% chance of yielding a correlation coefficient equal to or greater
This chapter includes two appendices:
|
End of Chapter 4.
Return to Top of Chapter 4
Go to Chapter 5 [Basic Concepts of Probability]
| Home | Click this link only if the present page does not appear in a frameset headed by the logo Concepts and Applications of Inferential Statistics |