©Richard Lowry, 1999-
All rights reserved.
Chapter 16.
Two-Way Analysis of Variance for Independent Samples
Part 4
The first difference between the present example and the first two is simply structural. In Examples 1 and 2 we had data arrayed in a matrix of two rows by two columns; now the arrangement is two rows by three columns. The second difference, of greater conceptual importance, is that we will now be analyzing data that derive not from an equal-interval scale of measurement, but from a merely ordinal rating scale. As noted in Chapter 14, the analysis of variance is quite robust—relatively unperturbed when its assumptions are not fully met—providing that the several groups of measures are all of the same size. These assumptions are the same for the two-way independent-samples ANOVA as for the one-way version:
- that the scale on which the dependent variable is measured has the properties of an equal interval scale;T
- that the several samples are independently and randomly drawn from the source population(s);T
- that the source population(s) can be reasonably supposed to have a normal distribution; andT
- that the several samples have approximately equal variances.
Although the flexibility afforded by this robustness applies most directly to assumptions 3 and 4, there is also a case to be made for its being extended to assumption 1. The details of that case are more complex than we would want to get into just now. Suffice it to say that it is less compelling than the case that can be made for flexibility with respect to assumptions 3 and 4. Compelling or not, however, you will often find the analysis of variance applied to rating-scale data, and for that reason you should have a sense of what such an analysis looks like. Toward the end of the chapter I will provide a simulation that might help you to reach your own conclusion on this question.
The data examined in this example come from the research project of an undergraduate student, conducted under the supervision of my Vassar colleague Jannay Morrow. The question at issue in the project was whether an individual's level of self-esteem is predictive of how he or she will perceive other persons. As a first step, 72 subjects (college students) were pre-sorted according to their relative self-esteem scores (high, medium,
The following table shows the ratings that resulted from the second question: how similar is this person to you? Note that there is a total of
| raw data | Subject's Self-Esteem| Low | Medium | High | Target's | Self- Esteem Low |
44 | 35 44 54 24 42
33 | 34 42 44 12 23
31 | 33 35 32 33 33 High |
22 | 42 23 24 22 23
43 | 12 13 24 31 14
32 | 32 34 34 43 34 | |||
Once again, we can zip through the computational details of the analysis with a minimum of commentary. (Click here if you would like a printable summary of the raw data and summary values for this example.)
Summary Values from Preliminary Number-CrunchingQ
| summary data | Subject's Self-Esteem| Low | Medium | High |
| rows | Target's | Self- Esteem Low |
Ng1=12 | ∑Xg1=45 ∑X2g1=179
Ng2=12 | ∑Xg2=35 ∑X2g2=113
Ng3=12 | ∑Xg3=35 ∑X2g3=111
Nr1=36 | ∑Xr1=115 High |
Ng4=12 | ∑Xg4=30 ∑X2g4=82
Ng5=12 | ∑Xg5=29 ∑X2g5=87
Ng6=12 | ∑Xg6=38 ∑X2g6=126
Nr2=36 | ∑Xr2=97
|
| columns |
Nc1=24 | ∑Xc1=75
Nc2=24 | ∑Xc2=64
Nc3=24 | ∑Xc3=73
NT=72 | ∑XT=212 ∑X2T=698 | |||||||||
Means and Graph of Group MeansQ
| Subject's Self-Esteem | 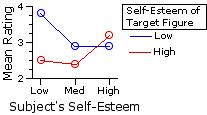
| |||||||||||||||||||||||||||
| Low | Medium | High | rows| Target's | Self- Esteem Low | Mg1=3.8 |
Mg2=2.9 |
Mg3=2.9 |
Mr1=3.2 | High | Mg4=2.5 | Mg5=2.4 | Mg6=3.2 | Mr2=2.7 |
|
| columns | Mc1=3.1 | Mc2=2.7 | Mc3=3.0 | MT=2.9 | | |||||||
Preliminary SS ValuesQ
Columns| col1 | col2 | col3 | Rows | row1 | SSg1=10.25 |
SSg2=10.92 |
SSg3=8.92 | row2 | SSg4=7.00 | SSg5=16.92 | SSg6=5.67 |
|
| SST=73.78 | | |||||||
| SSwg | = SSg1+SSg2+SSg3+SSg4+SSg5+SSg6|
|
| = 10.25 + 10.92 + 8.92 + 7.00 + 16.92 + 5.67 |
|
| = 59.67 | |
| SSbg | = SST — SSwg|
|
| = 73.78 — 59.67 |
|
| = 14.11 | |
| SSrows | = | (∑Xr1)2 Nr1 | + | (∑Xr2)2 Nr2 | — | (∑XT)2 NT
|
|
| = | (115)2 | 36 + | (97)2 | 36 — | (212)2 | 72
|
|
| = | 4.50 | |
| SScols | = | (∑Xc1)2 Nc1 | + | (∑Xc2)2 Nc2 | + | (∑Xc3)2 Nc3 | — | (∑XT)2 NT
|
|
| = | (75)2 | 24 + | (64)2 | 24 + | (73)2 | 24 — | (212)2 | 72
|
|
| = | 2.86 | |
| SSrxc | = SSbg — SSrows — SScols|
|
| = 14.11 — 4.50 — 2.86 |
|
| = 6.75 | |
The following table shows (in red) the values of [null]Mg* for each of the six groups, as calculated by the method described in connection with Example 1. As before, the observed means of the groups (3.8,2.9, etc.) appear in black. The graphs below the table show the observed group means in comparison with the pattern that would be expected if there were zero interaction between the row and column variables. Here again you can see the makings of an interaction effect.
means
Columns
col1
col2
col3
rows
rows
row1
3.8
3.4
2.9
3.0
2.9
3.3
Mr1=3.2
row2
2.5
2.9
2.4
2.5
3.2
2.8
Mr2=2.7
columns
Mc1=3.1
Mc2=2.7
Mc3=3.0
MT=2.9
observed expected 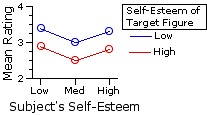
Degrees of FreedomQ
| degrees of freedom | in general | for the present example Total
| dfT = NT—1
| 72—1=71
| within- | groups (error) dfwg = NT—rc
| 72—(2)(3)=66
| between- | groups dfbg = rc—1
| (2)(3)—1=5
| rows
| dfrows = r—1
| 2—1=1
| columns
| dfcols = c—1
| 3—1=2
| interaction
| dfrxc = (r—1)(c—1)
| (2—1)(3—1)=2
| |
MS ValuesQ
| MSrows | = | SSrows dfrows | MScols | = | SScols dfcols | MSrxc | = | SSrxc dfrxc
|
|
| = | 4.50 | 1
|
| = | 2.86 | 2
|
| = | 6.75 | 2
|
|
| = | 4.50 |
|
| = | 1.43 |
|
| = | 3.37 |
|
|
| | ||||||||||||
| MSerror | = | SSwg dfwg
|
|
| = | 59.67 | 66 = 0.90 | |
F-ratiosQ
| Frows | = | MSrows MSerror | Fcols | = | MScols MSerror | Frxc | = | MSrxc MSerror
|
|
| = | 4.50 | 0.90
|
| = | 1.43 | 0.90
|
| = | 3.37 | 0.90
|
|
| = | 4.98 |
|
| = | 1.58 |
|
| = | 3.73 |
| with df=1,66
| with df=2,66
| with df=2,66 | ||||||||||||
Here is the portion of Appendix D that includes the critical values of F for
| df denomi- nator | df numerator |
Frows=4.98df=1,66 Fcols=1.58df=2,66T Frxc=3.73df=2,66T 1 | 2 | 3 | 66 | 3.99 | 7.04 3.14 | 4.94 2.74 | 4.09
| | ||||||
The following table shows a plot for each of these dimensions of the analysis, along with a little commentary. Recall that the dependent variable in this research is a subject's rating of the target figure in response to the question: how similar is this person to you?
Rows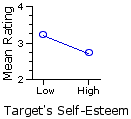
| The fundamental meaning of the significant row effect is that the difference between the two row means is greater than what could be expected on the basis of mere random variability. In the present instance it indicates that subjects rating the low self-esteem targets saw the targets as more similar to themselves than did subjects rating the high self-esteem targets. Recall that the row means in this example are calculated across all three levels (low, medium, | Columns | 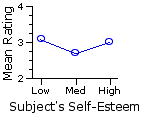
The fundamental meaning of the non-significant column effect is that the aggregate differences among the three column means are no greater than what might be expected on the basis of random variability. Hence the observed results provide no evidence that similarity ratings of the target figure differ in accordance with the self-esteem level of the subjects doing the ratings. Recall that column means in the example are calculated across both levels (low and high) of the target figure's imputed self-esteem.
| Interaction Observed | Expected Zero Interaction
As in the earlier examples, the interaction effect refers to the difference between (i) the observed pattern of group means and (ii) the pattern that would be expected if the combined effects of the row and column variables were merely additive. A significant interaction indicates that this difference reflects something more than mere random variability. For the present example, the short of it is that low and high self-esteem target figures are rated by subjects as more or less similar to themselves in accordance with the self-esteem level of the subjects. As evident from the adjacent graph, this is particularly salient when subjects in the lowest self-esteem category are rating a low self-esteem target figure, and when subjects in the highest self-esteem category are rating a high self-esteem target figure. (The fact that low self-esteem target figures, overall, are rated as more similar than high self-esteem targets is a reflection of the significant main effect for the row variable.)
| |
Ah! But here's the complication. Any conclusions concerning "significant" effects for rows, columns, or interaction in such an analysis are meaningful only in the degree that it is legitimate to perform the analysis using data that derive from a merely ordinal scale of measurement. Which is to say: only in the degree that the analysis of variance is "robust" enough to handle this particular non-compliance with its assumptions. We will address this question in Part 5. That final portion of the chapter will also include a summary of step-by-step computational procedures for the two-way independent-samples ANOVA.
End of Chapter 16, Part 4.
Return to Top of Chapter 16, Part 4
Go to Chapter 16, Part 5
| Home | Click this link only if the present page does not appear in a frameset headed by the logo Concepts and Applications of Inferential Statistics |