Calculators for Statistical Table Entries
Calculators for Statistical Table Entries
| | z to P|
| | chi-square to P |
| | t to P |
| | r to P |
| | F to P |
| | Fisher r-to-z transformation |
| | .05 and .01 critical values of the | Studentized range statistic Q
| | Odds & Log Odds | |
z to P Calculator
For any given value of z, this section will calculate
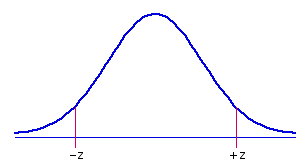
| º | the respective one-tailed probabilities of —z and +z;|
| º | the two-tailed probability of±z; |
| º | and the proportion of the normal distribution falling between —z and +z. | |
To proceed, enter the value of z in the designated cell and click «Calculate». Note that the programming for this section is able to perform meaningful probability calculations only for cases where |z|<5.

|
Click here to see the details of the sampling distribution to which any particular value of z belongs. |
| z = | ||||
| Probabilities | P |
Return to Top
Chi-Square to P Calculator
 For values of df between 1 and 20, inclusive, this section will calculate the proportion of the relevant sampling distribution that falls to the right of a particular value of chi-square. To proceed, enter the values of chi-square and df in the designated cells and click «Calculate».
| Chi-Square | df | P | ||||||
distribution to which any particular value of
chi-square belongs. At the prompt, enter the
appropriate value of df.
Return to Top
t to P Calculator
 This section will calculate the one-tail and two-tail probabilities of t for any given value of df. To proceed, enter the values of t and df in the designated cells and click «Calculate».
| t | df
|
| P | one-tailed | | two-tailed
| | ||||
distribution to which any particular value of t
belongs. At the prompt, enter the appropriate
value of df. Return to Top
r to P Calculator
If the true correlation between X and Y within the general population is
| t = | r sqrt[(1—r2)/(N—2)] |
is distributed approximately as t with
To assess the significance of any particular instance of r, enter the values of
| N = | r = |
| t | df | | |||
| P | one-tailed | | two-tailed
| |
Fisher r-to-z Transformation
For any particular value of r, the Pearson product-moment correlation coefficient, this section will perform the Fisher
| zr = (1/2)[loge(1+r) - loge(1-r)] |
| SEzr = 1/sqrt[n-3] |
| r = | n = |
| zr = | SEzr = | | |
Return to Top
F to P Calculator

This section will calculate the proportion of the relevant sampling distribution that falls to the right of a particular value of F, as defined by the degrees of freedom for the numerator and denominator of the F-ratio. To proceed, enter the values of F and df in the designated cells and click «Calculate».
| F | |
Click here to see the details of the | sampling distribution to which any particular value of F belongs. At the prompt, enter the df values for numerator and denominator. df | numerator | denominator | P |
| | |||||||
Return to Top
Critical Values of Q
This section will calculate the .05 and .01 critical values for the Studentized range statistic Q. To proceed, enter the number of groups in the analysis (k) and the number of degrees of freedom, and then click «Calculate». Note that the value of k must be between 3 and 10, inclusive.
| k | df | Q.05 | Q.01|
| | |||||||||
Return to Top
Odds & Log Odds
Given p, an observed proportion or probability:
Given the Log Odds:
Given the Odds:
Enter any one of these items—p, Odds, or Log Odds into the designated cell, then click the «Calculate» button to fetch the corresponding values of the other two. If entering p, the entry can be either a decimal fraction or a common fraction.
| p | Odds | Log
Odds| | | |||||
Return to Top
| Home | Click this link only if you did not arrive here via the VassarStats main page. |
©Richard Lowry 2001-
All rights reserved.