Fitting to a Poisson Distribution
|
If you have visited this page before and wish to skip the preamble, click here to go directly to the calculator. |
The frequency distributions of relatively rare or improbable events tend to approximate the form of a Poisson distribution, the defining characteristic of which is that its mean and variance are identical.
| k | Observed Frequency 0 | 1 2 3 4 28 | 20 8 3 1 |
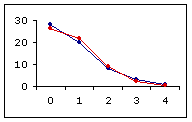
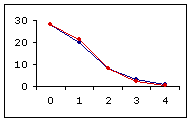
As shown in Graph A, below, the fit between the observed distribution and the theoretical Poisson distribution defined by mean=variance=.82 is a fairly close one. However, there are other Poisson distributions for which the fit is even closer. The most closely fitting of all is the one shown in Graph B, defined by mean=variance=.76.
Observed distribution fitted to a theoretical Poisson distribution with
A. mean=variance=.82
| B. mean=variance=.76
| |||
The programming on this page will find the Poisson distribution that most closely fits an observed frequency distribution, as determined by the method of least squares (i.e., the smallest possible sum of squared distances between the observed frequencies and the Poisson expected frequencies). To proceed, enter the observed frequencies for each relevant value of k, then click the 'Calculate' button. A frequency of zero can either be entered as numeral 0 or left blank.
| k | Observed | Fitted Poisson | ||
| Frequency | Proportion | Probability | Expected Frequency | |
Tvariance of observed sample = | ||
proportion of linear covariance: r2 = | ||
to which your data have been fitted, click here and enter at the prompt. |
| Home | Click this link only if you did not arrive here via the VassarStats main page. |
©Richard Lowry 2001-
All rights reserved.